
Are you still finding it difficult making use of the data at your disposal? Or you still don’t know how to effectively make use of big data. The problem facing most organisations and businesses is not lack of data, rather the enormity of it and the inability to correctly harness this data.
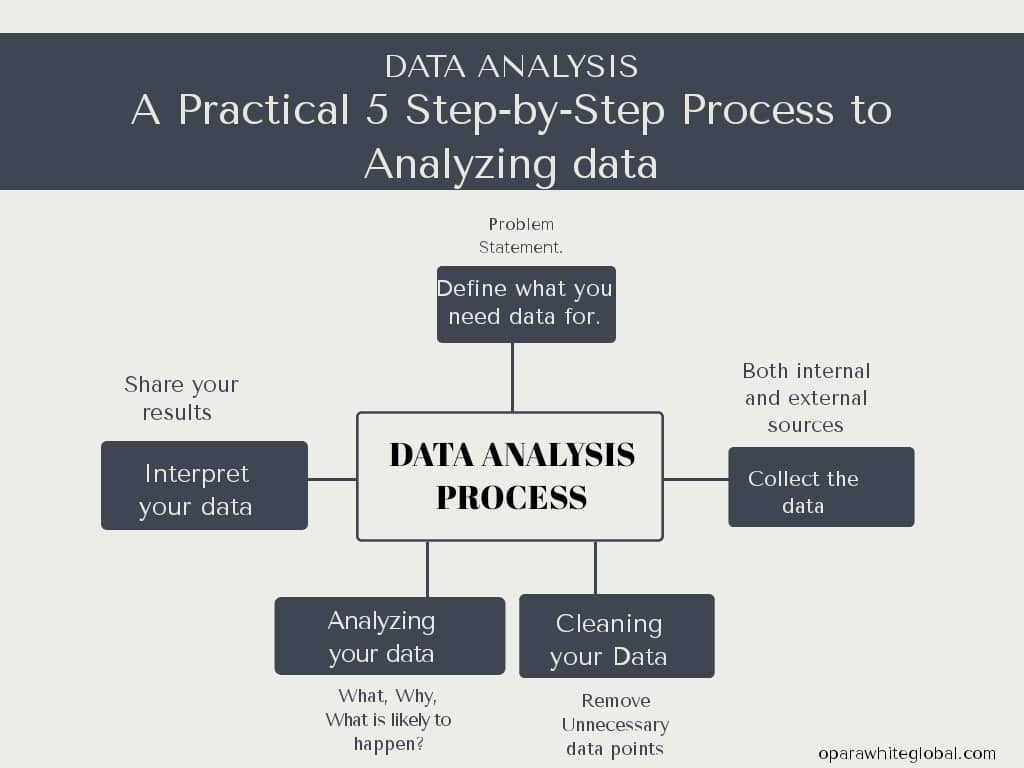
For this reason in this blog post, we have provided you with a practical step-by-step solution to analyzing data. Here are the five simple steps:
- Defining what you need data for
- Collecting the data
- Cleaning your data
- Analyzing your data
- Interpreting your data/Sharing your results.
What better way to take your business to the next level and scale the competition than to make informed decisions using well collected and analyzed data. Data is generated every day but this data is left in repositories without harvesting their full usage.
Data can hold valuable insights into markets and users and also help businesses find out new product opportunities.
Read up Data Analysis: The 7 methods explained in detail to understand different methods of data analysis,
Follow these five practical steps to draw your conclusions and sort through the numerous available data.
Step 1: Defining what you need data for
Table of Contents
This is the first step in processing data. This means coming up with a hypothesis and figuring out how to test it. Before you can make any progress, you should define exactly what it is you want to find out. What do you need data for? This will even help you know the kind of data you’ll collect. Often, in defining your problem the first question you ask may not be what it is. It is the data analyst’s job to understand the business and its goals to enable him to frame the real question.
For example, as a business owner, you noticed that you are no longer making sales as you used to. So you ask, “why are we not making any more sales despite having quality products?” A data analyst may critically look at the situation and finds out your sales team made a slight change in their strategy. Could this be why they aren’t making sales? Then he may end up asking, what negative impact is this slight change having on the customers?
Usually, the first question is not the core of the problem, seek to find the core of the problem first. In analytics jargon, it is called a “problem statement”. Besides, you need to know what you are looking for before you can find it.
Step 2: Collecting data from sources.
The kind of objective you have will determine the kind of data you’ll collect, whether qualitative e.g customer reviews or quantitative (numbers). You need to create a strategy for collecting data. Which sources can help you solve your business problem? Also, once you have decided to gather data, remember to keep these points in mind;
- Find out what information you can collect from existing sources and collect them first. Look through your CMS files, ask your IT teams for data that is available to them.
- If you will need to gather data through interviews then draft your interview template earlier on to help you stay organised and save time.
- Determine your file storing system before time, to enable your team members to save time by collaborating and not collecting the same data twice.
- Always add collection dates to your data and any other information, this will help you conclude as you go.
There are three main categories of your data source;
- First-party: This is data gotten directly from your customers, either through customer reviews, CMS system etc.
- Second-party: This includes data gotten from other companies and organizations. This data is usually structured whereas the first-party data is not.
- Third-Party: This is gotten from third-party organizations mostly used for industry reports and is available for you to use. This data is usually unstructured.
After collecting your data, then you’ll move over to the next step which is cleaning the data.
Step 3: Cleaning and exploring the data.
This involves squeezing and scrubbing your data to remove all unwanted data that could cause your process to be erroneous. Cleaning your data is the most crucial part of this process as if it’s not correctly done may affect your results. 80-90 per cent of the process is spent here. Just like the old saying– “if you are given 10 days to cut a tree, you’ll use 9 days to sharpen the axe”.
This is just how it is and another thing is, this is the most boring part of the work, but also the most sensitive.
While cleaning your data and getting it ready for analysis, note this;
- You are removing unwanted data points and major errors; you may have data that you do not need, based on your objective (this is why step 1 is highly important).
- Bringing structure to your data; this is more like tidying up and fixing layout issues to manipulate your data more effectively.
- As you tidy and organize your data, you may find out some important data are missing, you’ll need to fill it up.
Apart from cleaning the data, many analysts carry out exploratory analysis to discover patterns and trends they may not have noticed initially. This may at times refine your hypothesis.
For example in our illustration, our analyst thought that the problem could be from the new process employed by the sales team. But while exploring the data, they may find out that the problem is industry-related may be due to changing seasons of the year or economy.
Remember to take your time.
Step 4: Analyse your data.
Now that you’ve cleaned your data, it’s time to analyze it. There are several methods of analysing data, the particular methods you’d use largely depends on what your initial objective is. You can either decide to use quantitative, predictive, prescriptive or descriptive analysis.
Descriptive analysis; this is where you find out that something is wrong. You then try to determine what is wrong just like in our step one. This is usually the first step in any analysis process.
Diagnostic analysis; this is where you ask why. Determine to find out the reason for the changes. For example, when we found out in our illustration that the new process by the sales team is affecting the sales, we want to now know why. This most times prompt more research.
There are several methods you can use to go about it. Read more here; 7 methods of data analysis explained in detail.
Step 5: Interpreting your data.
After analysing your data, it’s time to flaunt it! Yes, you went through this process because you want us to see something. Now if you don’t present this well and we don’t understand it, it wouldn’t yet be complete.
The final step of this analysis process is to share your insights with the world or your company stakeholders. People who will be using your results are people who make decisions every day so what you present directly affects their decision. For this reason, you’ll need to remain as open as possible and give honest feedback regarding your conclusions.
While sharing your results and interpreting your data, bear in mind that you can’t ever prove a hypothesis true or reject it however if the data either accepts or rejects your original question then you have gotten somewhere. So ensure that you present your insights clearly and unambiguously to help your users make better decisions.
Most data analysts use reports, dashboards, interactive visuals and good communication skills to support their findings.
Wrapping up…
During these processes you might encounter some mistakes, probably some errors along the line or you discover points you missed which might take you back to square one, do not fret nor give up but enjoy the process.
Embrace these mistakes as they will help you become better. With time you’ll get better and faster at analysing data.
If you work with these 5 steps in your data analysis, you will be making better choices in your business or organisation. This is because your choices are backed up by well collected and analysed data that can be scientifically proved.
Got any questions? Let us know.
